Why do some lines move fast while others stall? The answer often lies in math.
Understanding queueing models is essential for businesses aiming to improve service efficiency and customer satisfaction. This article delves into the M/M/1 and M/M/c queueing models, their applications across various industries, and how VirtuaQ, a smart queue management system, applies this theory to real-world operations.
What are M/M/1 and M/M/c Queues?
At their core, these models help us predict how a line will behave based on how fast people arrive and how fast they are served.
M/M/1 Queue Explained
The M/M/1 queue is the simplest model. It represents a single-server system (like a small coffee shop with one barista).
The notation stands for:
- M (Markovian): Arrivals follow a Poisson process (arrivals are random and independent).
- M (Markovian): Service times are exponentially distributed (random variation in how long service takes).
- 1: Indicates there is a single server handling incoming customers.
Key Performance Metrics
In an M/M/1 queue, business owners look at:
- Average Waiting Time ($W$): The expected time a customer spends in line before being served.
- Traffic Intensity ($\rho$): The ratio of arrival rate to service rate.
For example, if a bank has an average arrival rate of 10 customers per hour ($\lambda = 10$) and the teller serves 12 customers per hour ($\mu = 12$):
$$\rho = \frac{\lambda}{\mu} = \frac{10}{12} \approx 0.83 < 1$$
Because $\rho < 1$, the system is stable. If $\rho > 1$, customers arrive faster than they are served, and the line will grow indefinitely.
M/M/c Queue Dynamics
The M/M/c queue extends this model to systems with multiple servers ($c$). Customers arrive in one line but are serviced by any of the $c$ available parallel servers (like a bank with a single line leading to 3 tellers).
Comparative Analysis
- Service Efficiency: An M/M/c system reduces wait times significantly by handling peak loads through parallel processing.
- Cost Implications: While service improves, operational costs rise due to additional staff ($c$). The objective is to identify the optimal balance point between operational expenses and service speed.
Mathematical Foundations
Both queue types rely on critical mathematical equations to predict stability.
- For M/M/1 queues, the average number of customers in the system ($L$) is:
- $$L = \frac{\lambda}{\mu - \lambda}$$
- For M/M/c queues, the stability hinges on the utilization factor:
- $$\rho = \frac{\lambda}{c \times \mu}$$
An Illustrated Example
Let’s look at a hospital scenario to see why the math matters.
- Arrivals: 20 patients per hour ($\lambda = 20$).
- Capacity: Doctors can treat 6 patients per hour ($\mu = 6$).
- Staff: There are 4 doctors on duty ($c = 4$).
$$\rho = \frac{20}{4 \times 6} = \frac{20}{24} \approx 0.83$$
Since $0.83 < 1$, the system is stable. However, if the hospital cuts costs and only rosters 2 doctors, the math changes drastically:
$$\rho = \frac{20}{2 \times 6} = \frac{20}{12} \approx 1.66$$
Because $1.66 > 1$, the system is overloaded. The queue will grow without bound, leading to critical delays.
Practical Limitations: The Human Factor
While the math provides a framework, the real world is messy. Theoretical models assume customers behave like predictable numbers, but in reality, human psychology affects the queue:
- Balking: A customer sees a long line upon arrival and refuses to join it entirely.
- Reneging: A customer joins the queue, waits for a while, loses patience, and leaves before being served.
- Jockeying: In multi-line systems, customers constantly switch lines hoping to move faster (often causing inefficiency).
These behaviours can distort theoretical calculations—unless you have a system that tracks them.
Bridging Theory and Reality with VirtuaQ
Theory is useless without accurate data. You cannot calculate your Traffic Intensity ($\rho$) if you don't know your real-time Arrival Rate ($\lambda$).
VirtuaQ acts as the bridge between theoretical models and physical reality.
1. Real-time Data for Model Accuracy
VirtuaQ tracks actual arrival rates and service durations in real-time. This allows managers to adjust staffing ($c$) dynamically. If VirtuaQ detects that $\lambda$ has spiked, it alerts managers to open another counter, keeping $\rho < 1$.
2. Mitigating Balking and Reneging
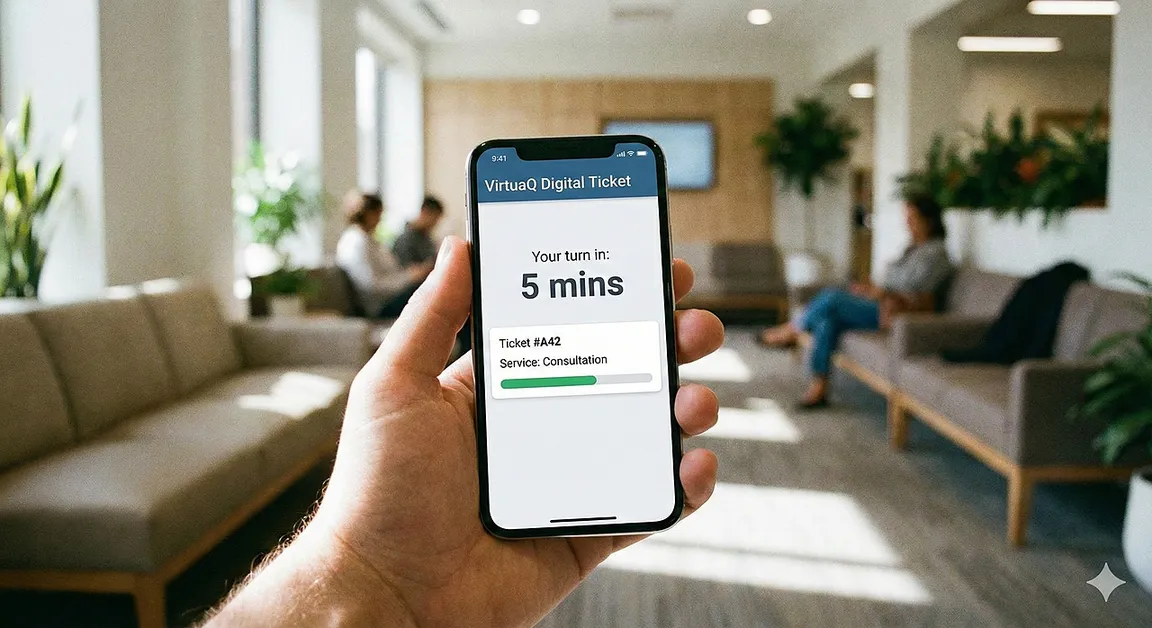
- Virtual Queuing: By allowing customers to join a queue via mobile app or SMS, they aren't physically confined to a line. This reduces the psychological stress of waiting, significantly dropping reneging rates.
- Transparency: VirtuaQ provides estimated wait times. When customers know exactly how long the wait is, they are less likely to balk.
Case Study: Government Office Optimization
Consider a probable scenario involving a local DMV implementing VirtuaQ:
- The Problem: High arrival rates ($\lambda$) with fixed servers caused bottlenecks. Wait times exceeded 45 minutes, leading to high abandonment (reneging).
- The Solution: DMV implemented an M/M/c logic using virtual ticketing. High-complexity transactions were routed to senior staff, while quick tasks went to express counters.
- The Result:
- Wait times reduced from 45 mins to under 15 mins.
- Customer satisfaction scores increased by 30%.
- Staff utilization remained balanced, preventing burnout.
Conclusion
By leveraging insights from M/M/1 and M/M/c queueing models, organizations can transform their service delivery. However, the model is only as good as the data feeding it. VirtuaQ exemplifies how technology can operationalize these theoretical principles, turning abstract math into reduced wait times and happier customers.
Stop guessing your staffing needs and start calculating them. Transform your organization’s queue management today! Explore how VirtuaQ’s innovative solutions, backed by robust queueing theory, can lead to measurable performance enhancements in your business.